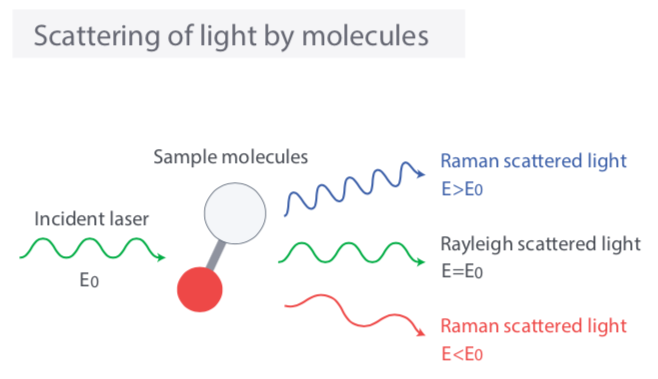
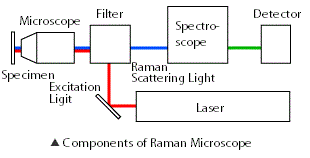
When light is irraidated on molecules, the light is scattered by molecules. Most of scattered light have the same frequency with incident light but some fraction of light have different freqency due to interaction between oscillation of light and molecular vibration. The phenomenon that the light is scattered with frequency change is called Raman scattering. Because this frequency modulation is specific to molecular vibration and phonon in crystal, it is possible to analyze composition of material or crystal lattice information by anayzing spectrum of Raman scattered light. This analysis method is Raman spectroscopy. Furthermore to analyze in microsocpic area with Raman spectroscopy, Raman spectroscopy is combined with Microcope as Micro Raman Spectroscopy.
Recently it is becoming very popular that Raman spectrum are measured at every point in area and microscope image at certain spectrum band is reconstructed to see distribution of spectral information. Raman instrument that has an ablitiy to show Raman spectral image is called Raman microscope.
Becuase it is very long to measure Raman spectra at all points in area, some few Raman makers are adopting the fast imaging method. Among them, Nanophoton technology is the fastest method. RAMANtouch has multi-channel spectrocopy techonoly that measures multi spectra at the same time. Typically 400 spectra are measured simultaneously while other method is spectral measurement one by one.
What is Raman spectrum?
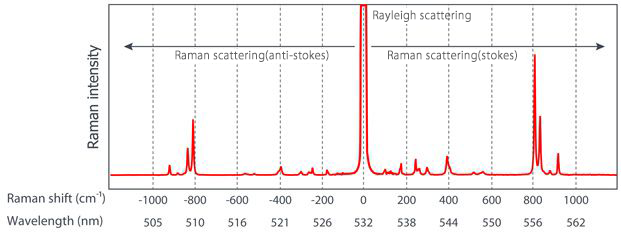
Raman scattered light contains various information on molecules in a substance. If you separate the scattered light by wavelength in order to interpret them, you can see that Rayleigh scattered light equal to the wavelength of the incident light is strongly detected and Raman scattered light is detected on both sides as shown in the above figure. Raman scattered light detected on the shorter wavelength side than Rayleigh scattered light is called anti-Stokes line, and that detected on the longer wavelength side is called Stokes line. In general, Stokes lines with higher intensity are used for analysis.
The information of each dispersed wavelength is converted to wavenumber (1 / wavelength) and the difference with the wave number of incident light is calculated. The difference between the wavenumbers on the horizontal axis and the intensity on the vertical axis is called a Raman spectrum. From the horizontal axis, you can read molecular vibration information, and from the vertical axis, you can read the strength of activity.
The following video is a video of Raman scattered light of water. You can intuitively understand Raman scattering by looking at it visually. Please take a look.
Things you can see with Raman spectroscopy
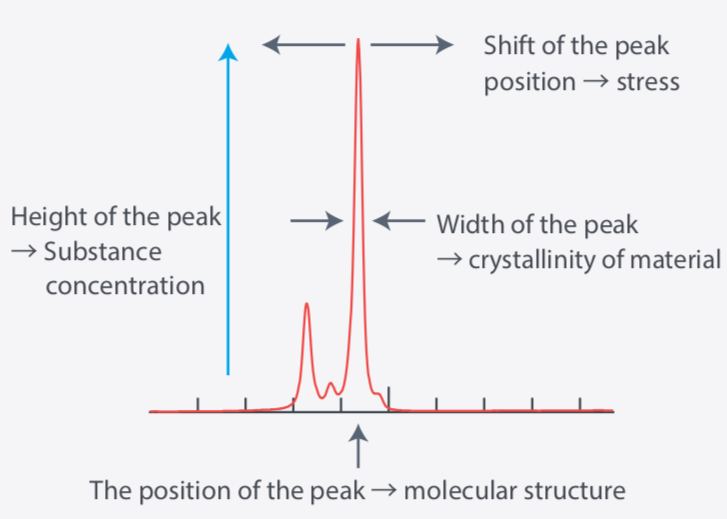
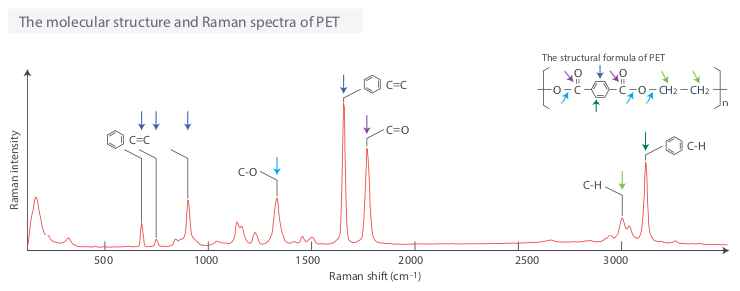
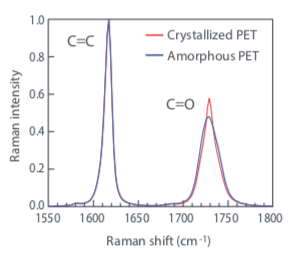
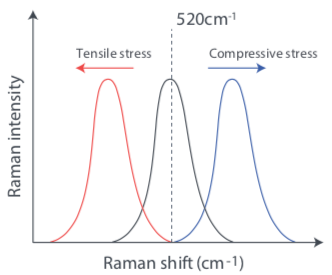
The vibrational information of the molecule can be read from the horizontal axis of the Raman spectrum, and the intensity of activity can be read from the vertical axis (right figure). Specifically, one can identify the type and quality of chemical bonds. Moreover, if it is a crystalline substance, the degree of 2 crystallization and distortion of 3 crystal lattice can be known.
Applications
ラマン分光法を用いた様々な測定例はこちら