Just 20 minutes imaging of components distribution on the surface of positive electrode
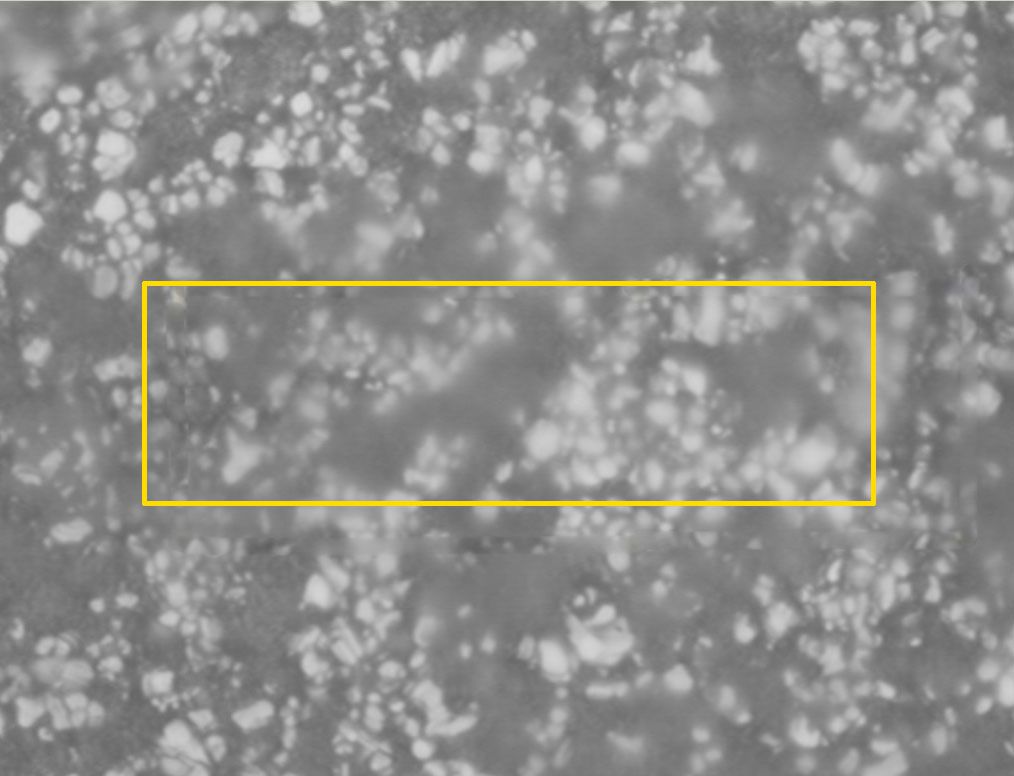
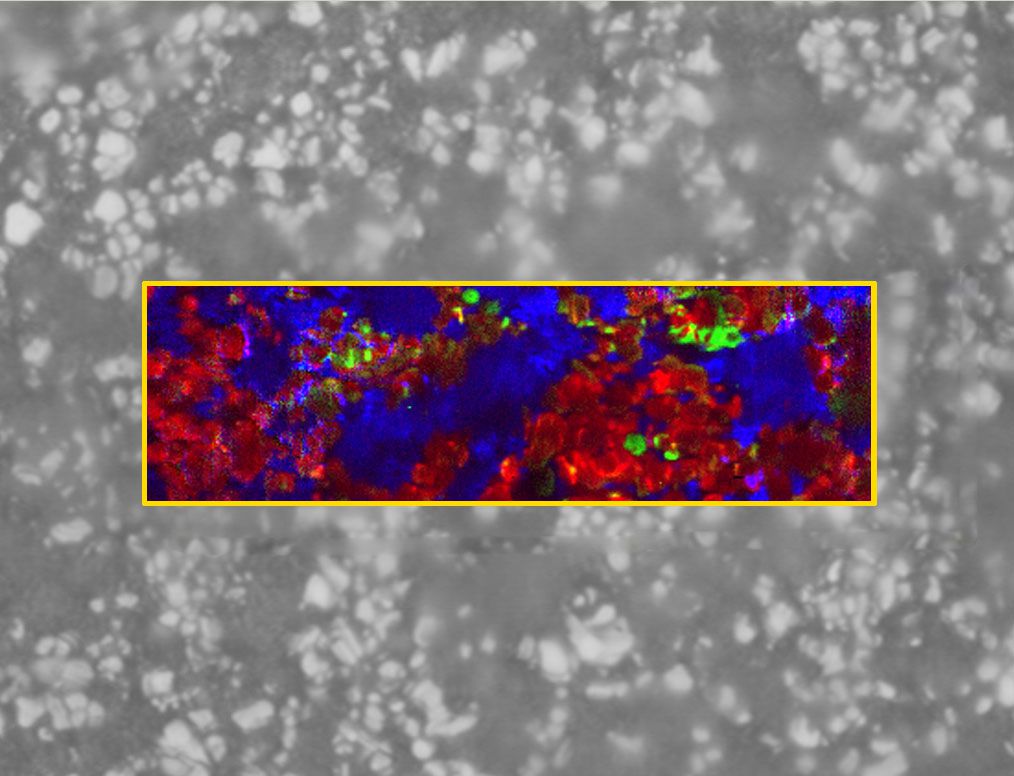
Above image shows an image of positive electrode in Lithium-ion battery analyzed by Raman microscopy. LiCoO2, which is active material, and acetylene black, which is conductive additive, are shown by red and blue image respectively. Within just 20 minutes, components distribution in wide area is obtained by Raman imaging with high-spatial resolution of the order of 350nm.
■Detail of the sample for the measurement
A mixture of LiCoO2, acetylene black and polyvinylidene fluoride with N-methylpyrrolidone are coated on both surfaces of alminum film and dried.
Observation of components distribution on positive electrode surfaces
Following graph shows averaged Raman spectrum in selected area, which is red and blue square in lower right hand picture, on observed Raman image. Spectrum in red square has 2 peaks of 485cm-1 and 597cm-1 related to LiCoO2. On the other hand, Spectrum in blue squqre has 2 peaks of 1350cm-1 and 1590cm-1 related to carbon.
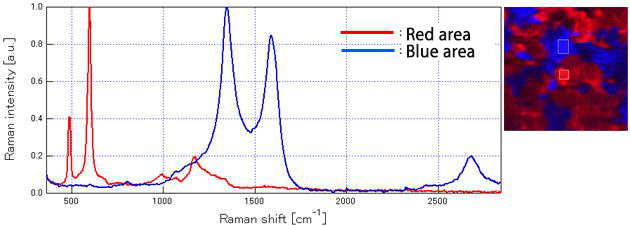
Averaged Raman spectrum in selected area, which are shown in red and blue square in lower right hand picture
Observation of components distribution on positive electrode surfaces after degradation

Above picture shows an image of positive electrode in Lithium-ion secondary battery degraded by laser light analyzed by Raman microscope under the same field of view as shown previous picture. With degradation of electrode, it is seen that LiCoO2 (red), acetylene black (blue) and cobalt oxide (green) are generated.
Following graph shows averaged Raman spectrum in selected area, which is red ,blue and green square in lower right hand picture, on observed Raman image. With degradation of electrode, it is seen that not only CoLiO2 (red) and carbon (blue) but also new components (green) which has several peaks in the reagion of lower wavenumber are generated. Focusing onto the Raman spectrum in the reagion of lower wavenumber, it is recognized that the spectrum selected in the green square has peaks of 482, 522 and 691cm-1 related to Co3O4.
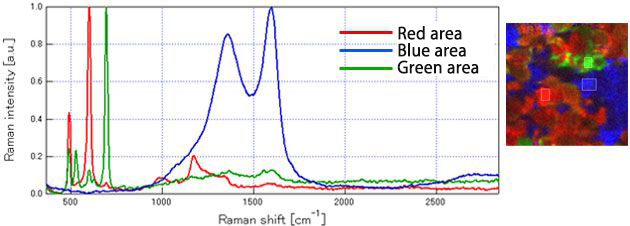
Avaraged Raman spectrum in the selected area which are shown in red, blue and green square respectively
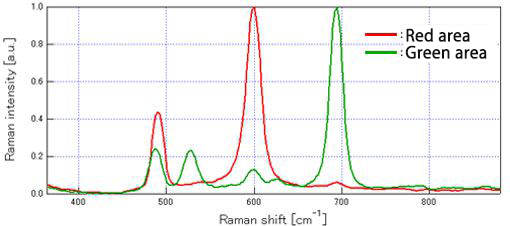
Expanded spectrum within lower wavenumber reagion of averaged Raman spectrum selected in red and green square
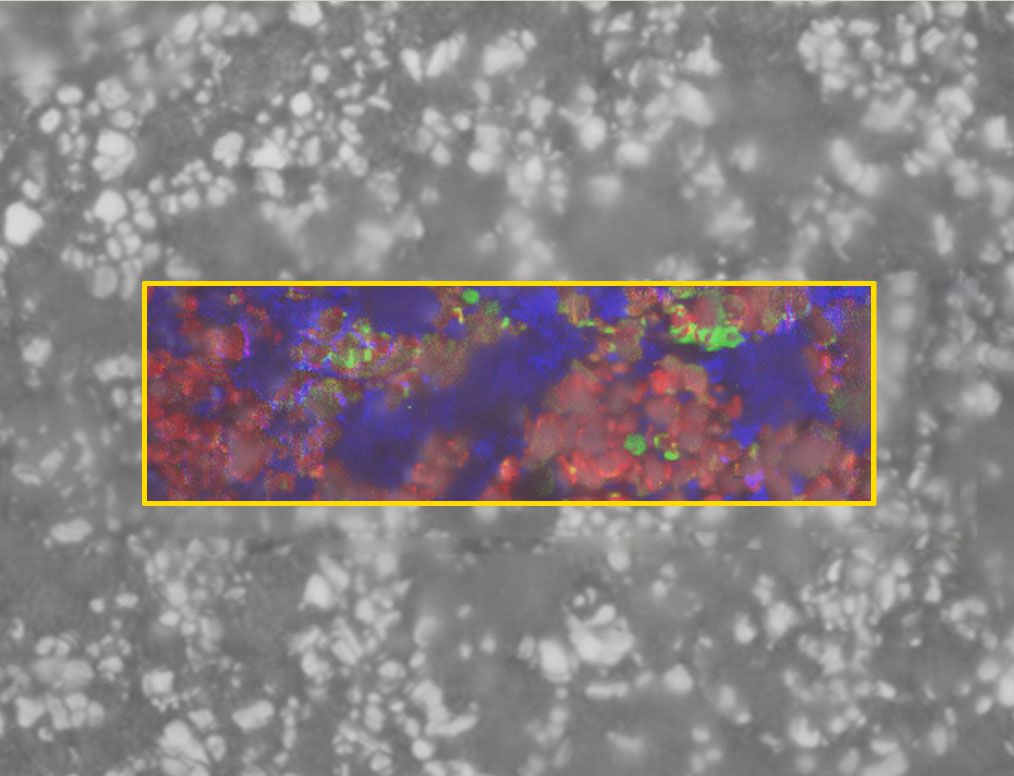
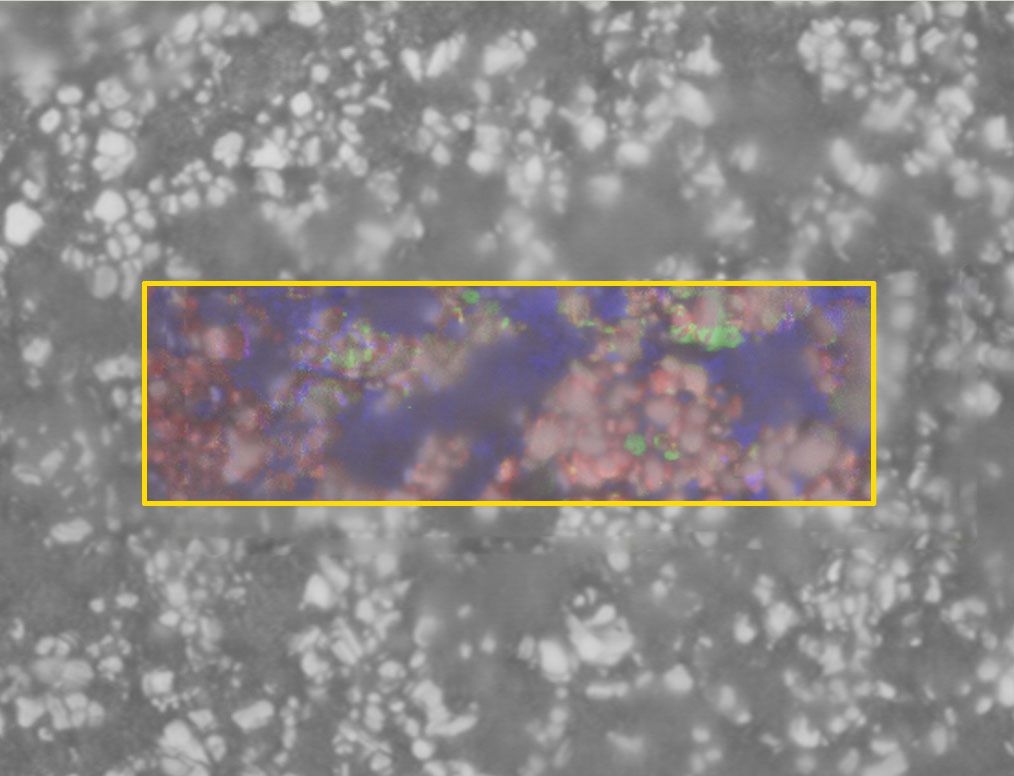
Overlaid image with optical microscope image and raman image
RAMAN-11 can show overlaid image with Raman image and optical microscope image after the measurements. The transparency of the Raman image can be changed as you wish by changing slider position from side to side on the software. As just described, RAMAN-11, which can image components distribution in the electrode materials within just 20 minutes, is a powerful tool for analyzing and evaluating of secondary battery materials.
Nanophoton product
→充放電in-situラマン測定用セル LIBcell charge
→不活性雰囲気ラマン測定用密閉容器 LIBcell
