Life science
Intracellular distribution of cholesterol
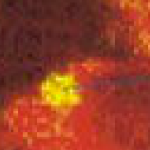
The left panel shows the Raman image of the HeLa cells with deutrium-substituent cholesterol. The peaks of deutrium-substituent(2212cm-1) and Amid-1 of proteins (1660cm-1) correspond to green and red, respectively, in the image. The image shows localization of the deutrium-substituent cholesterol in yellow domains (overlay of green and red). The right figure shows the Raman spectra of the area of cholesterol localization and the other. Raman imaging is a powerful tool for visualising lipid without labelling. Comparison of Raman spectra of deutrium-substituent cholesterol and normal cholesterol.Deuterium-substituent cholesterol has Raman peaks at 2066cm-1, 2121cm-1, and 2212cm-1.