The ratio of ingredients contained in cheese and the phase structure are said to be important factors that affect the texture and taste impression. However, it is difficult to observe the shape of cheese as it is necessary to perform pretreatment such as immobilization and staining of protein and observation under low vacuum by the generally used observation methods at present. . On the other hand, Raman imaging does not require pretreatment such as staining or the vacuum environment at the time of measurement, so it is possible to observe the distribution of components such as protein, fat and water as it is.
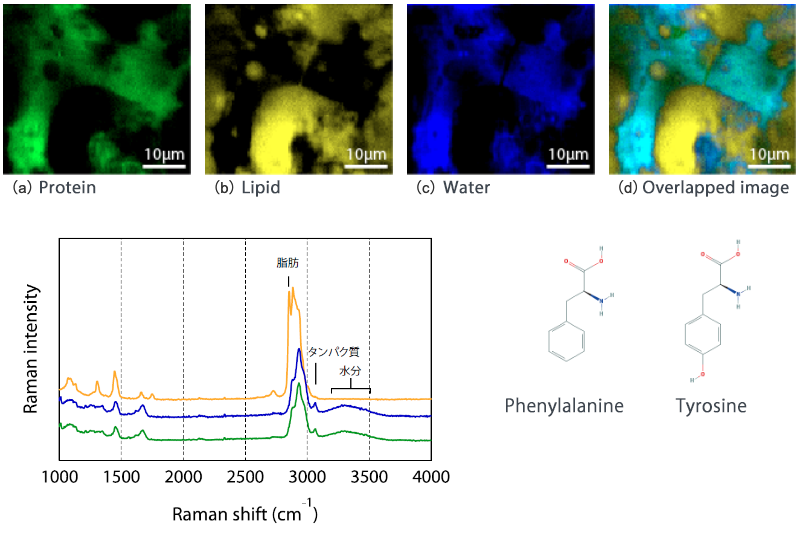
The figure below shows a frozen section of mozzarella cheese mounted on a slide glass and measured at normal temperature and pressure, and the distribution of protein (■), lipid (■) and water (■) is represented by Raman imaging. The distribution of the protein was determined from the 3060 cm-1 peak intensity derived from aromatic amino acids such as phenylalanine and tyrosine.

| Excitation wavelength | 532 nm |
| Objective lens | 50x (NA=0.80) |
| Number of spectra | 40,000 |
| Measurement time | 9 min and 20 sec |
The graph above is the average Raman spectrum of the region where protein, fat and water are abundant. The Raman spectrum of water appears as a broad peak from 3200 cm-1 to 3500 cm-1, but there is a difference that bound water has a peak near 3200 cm-1 and free water has a peak near 3500 cm-1. From the spectrum shape of the water-rich area shown in blue, it is clear that most of the water is bound to the protein, and the protein and fat exist in an interlocking manner. In this case, we used freeze section processing to observe, but you can observe almost the same way with a cross section that has just been cut with a scalpel.
Characteristics of cheese from the viewpoint of tissue structure
▼ Low magnification Raman image of processed cheese and mozzarella cheese(■: Protein, ■:Lipid)


| Excitation wavelength | 532 nm |
| Objective lens | 20x (NA=0.45) |
| Number of spectra | 40,000 |
| Measurement time | 8 min and 20sec |
The figure above is a Raman image of commercial mozzarella cheese and processed cheese measured at low magnification. Mozzarella cheese has protein and fat distributed like streaks, compared to protein-based small fat spheres of 1 μm to 10 μm dispersed in processed cheese. Processed cheese is generally produced by finely cutting natural cheese into small pieces and heating and reshaping, so it has a finer phase structure than natural cheese. Mozzarella cheese, on the other hand, is made by repeating the process of drawing and pulling in hot water with a pH of 5.2 to 5.4 and a temperature of 60 ° C, and it can be predicted that the stretching process produces a streaky distribution. The unique texture, like the fiber of mozzarella cheese, may be derived from this streaky structure.
※ This sample was provided by Fuji Oil Co., Ltd.