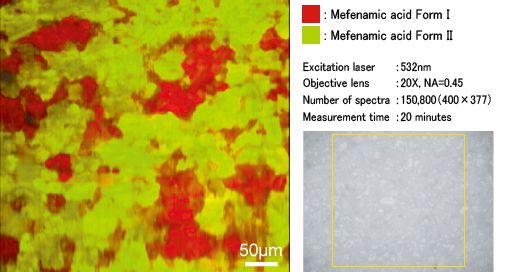
Crystalline polymorphs imaging can be achieved only 20 minutes.
The upper image is the distribution of a mixture of mefenamic acid of two different crystalline form by fast Raman imaging. Red color shows the crystal form I, Green color shows the distribution of crystal form Ⅱ. The Raman imaging measurement time is about 20 minutes and a spatial resolution is about 700nm, the size of the image is 0.5mm x 0.5mm.

■About the sample
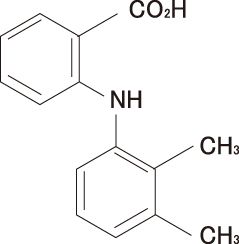
In this measurement, the crystalline polymorphs of mefenamic acid, that is for anti-inflammatory, analgesic, antipyretic effect, are measured by Raman spectroscopy. Because there are differences in the efficacy of the medicinal ingredient is different crystal forms, crystalline form control has become an important issue in pharmaceutical processes. As analysis method to identify the crystal form, there are X-ray diffraction and Raman spectroscopy, Raman spectroscopy, which does not require the vacuum condition, has been used for screening.
Raman analysis of crystalline polymorphs of mefenamic acid
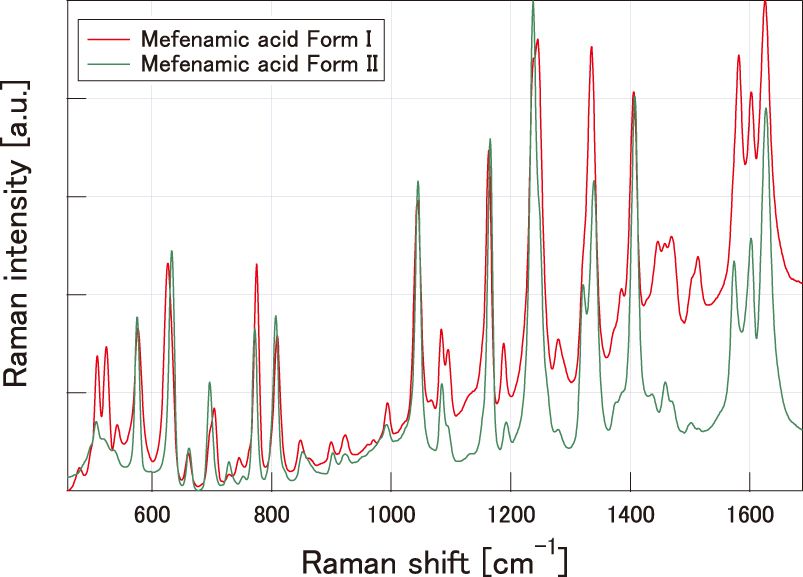
Spectrum shown on the right is the Raman spectrum of the crystalline polymorphs of mefenamic acid. Differences of crystalline form can be identified from the difference of the Raman spectrum. In the case of mefenamic acid, because the positions of the Raman peaks are substantially the same, it is possible to identify only the peak position of each crystal form by using principal component analysis, which is one of multivariate analysis in the identification and distribution analysis.

Ref: Raman spectrum analysis
In principal component analysis, which is one of the multivariate analysis, the spectrum data is structured as multi-dimensional data of wavenumber and intensity, and decomposed to component spectrum. By removing the noise-like spectrum of component spectrum, the high quality Raman data can be reconstructed.
RAMANtouch, which spatial resolution is 350nm, featuring ultra-high-speed line lighting, we demonstrate the power overwhelming to detect polymorphic crystalline drug at the micro-order by combining the principal component analysis.