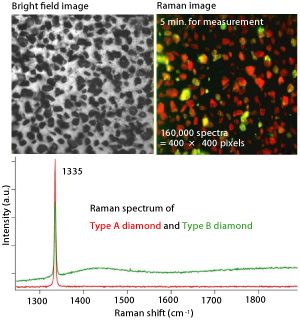
These figures shows a bright field and Raman image of a diamond file. The Raman spectra of the two types of diamond (A and B) are also shown in the figure. The Raman image shows that two types of diamondare distributed on the file. The distribution of the diamond type A and B is shown in red area and green area in the Raman image, respectively. The fraction of overall diamond area occupied in the whole Raman image is 68.94%. The percentage of type B diamond against type A is 7.96%. This observation takes only 5 minutes.
