| Excitation | 532 nm |
| Obj. lens | 100x (NA=0.90) |
| Number of spectra | 13,200 (400×33) |
| Measurement time | 16 min |
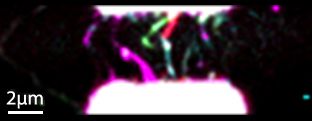
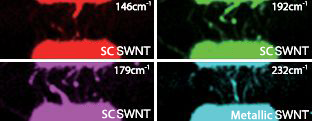
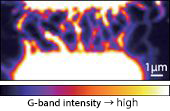
The images above show Raman images of a carbon nanotube field-effect transistor (CNT-FET). Many types of CNTs are distributed between two electrodes (upper and lower side of Raman image) and they can be observed minutely by high-resolution Raman imaging of RAMANtouch/RAMANforce. According to the Kataura plot, each single-walled carbon nanotube (SWNT) can be identified as semiconductor- or metal-SWNT by position of RBM peaks.
*This sample is provided by Prof. Shigeo Maruyama at The University of Tokyo.
Pixel by pixel analysis is possible by intuitive software
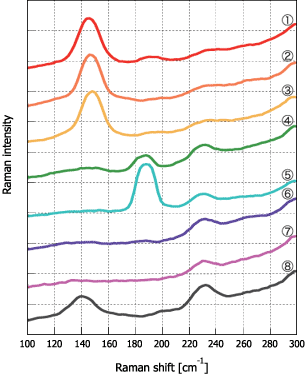
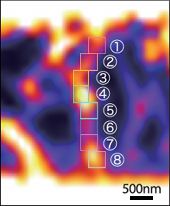
The graph on the left shows the averaged spectra in each selected region indicated in the lower right Raman image. Each spectrum is indicated by the same number. From the transit of RBM peaks from No.1 to No.8, it can be observed that CNTs with different chiralities overlap with each other and distribute between the electrodes.
RAMANtouch/RAMANforce software is able to show the instant spectrum by clicking and dragging at desired point or area. Moreover, the coloring function provides an easy and efficient tool for spectrum comparison.
Explanation of Raman spectrum of CNT
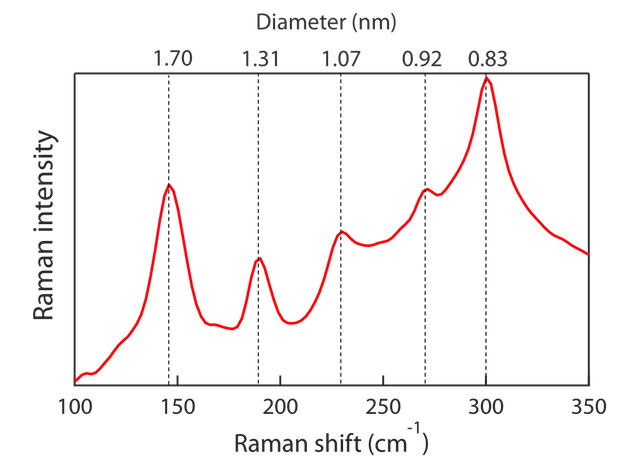
The graph on the right is the Raman spectrum of carbon nanotubes. Typical of Raman peaks of carbon nanotubes are RBM (Radial Breathing Mode), D band and G band. You can obtain information such as CNT diameter, chirality and defects from those peaks. Each peak is explained below.

About RBM (Radial Breathing Mode)
RBM is a mode in which SWNTs expand and contract in the diametrical direction. A peak appears on the low wave number side (100 to 300 cm-1), and its peak position ωRBM (cm-1) has the following relationship with the diameter d (nm) of SWNT. By using this, it is possible to evaluate the diameter of SWNT contained in the sample as shown in the right figure.
In carbon nanotubes, we observe resonance Raman scattering that occurs when the excitation wavelength matches the optical transition energy of the substance. Therefore, in order to observe SWNTs with different chirality comprehensively, it is necessary to use many excitation wavelengths for measurement.
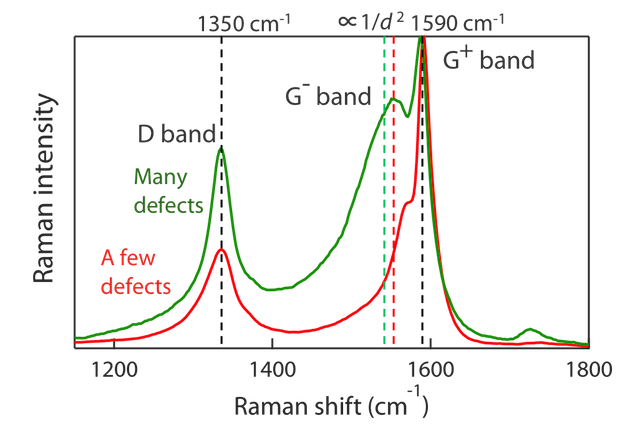
About G-band
The peak around 1590 cm-1 derived from the in-plane vibration of the six-membered ring common to carbon-based substances. In the case of carbon nanotubes, the degeneracy of the G band is resolved and split into G + and G- (G + corresponds to the longitudinal wave (LO) mode in the CNT axial direction, and G- corresponds to the transverse wave (TO) mode perpendicular to the axis) ). The frequency of G + appears near 1590 cm-1 regardless of the diameter of the carbon nanotube, while the frequency of G- changes in inverse proportion to the square of the diameter.
About D-band
It is a peak around 1350 cm-1 derived from the defect. The intensity ratio of G band to D band (G / D ratio) is used as an indicator of the amount of defects in CNT. If the G / D ratio is large, it can be judged that the CNTs have few defects, and if the G / D ratio is small, they are carbon nanotubes having many defects.