What is the basis of laser irradiation conditions in Raman spectroscopy? What kind of spectrum can be obtained and what kind of optical microscope image will be obtained if the sample has burnt? By setting the conditions correctly, you can shorten the measurement time and obtain a clear Raman image and spectrum.
Concept of laser irradiation condition
The conditions are determined so that a high-S/N ratio Raman spectrum can be obtained in a short time measurement. Especially for Raman imaging, this condition is important because it determines the time it takes to acquire an image. The following shows how to determine the conditions for laser wavelength, power, exposure time, and averaging numbers.
Wavelength……The wavelength of the laser light basically should be a shorter wavelength. That is because the shorter the wavelength, the more efficient the Raman scattering. However, when fluorescence occurs and the signal of Raman scattered light is buried, laser light with a long wavelength is used to avoid fluorescence.
Laser Power…… Laser power should be as strong as possible without damaging the sample. The upper limit of laser power depends on the sample. Transparent and white samples that do not absorb light easily have a high upper limit, and black samples have a lower upper limit. By gradually increasing the power of the laser light, it is possible to adjust to the appropriate power without damaging the sample.
Exposure time…… Determine the exposure time to obtain enough Raman spectrum intensity.
Averaging number…… When the signal strength is low, it is effective to reduce noise with increasing averaging number. If fluorescence occurs and the exposure time can not be extended, the signal-to-noise ratio can be increased without saturating the signal.
Standard of laser power by kind of sample
There are indications of power depending on the type of sample. First, make measurements with small power, and gradually increase the laser power if sufficient SN can not be obtained. If you use a laser power that is larger than the standard, it is better to condition the sample at the end of the sample, because the sample will burn.
| Samples | Point illumination | Line illumination |
| Carbon materials that are likely to burn (carbon black, CNT, etc.) | 1 ~ several mW | 0.02 ~ 0.1 mW/pixel |
| Stable carbon materials such as graphene | Several mW | 1 ~ Several mW/pixel |
| Organic matter in general such as synthetic resin | Dozens of mW | 1 ~ Several mW/pixel |
| Inorganic materials | Several tens of mW | Several mW/pixel |
Measurement example of change of spectrum by condition
Let’s look at the change of the signal-to-noise ratio for each irradiation condition to ethanol as a sample.
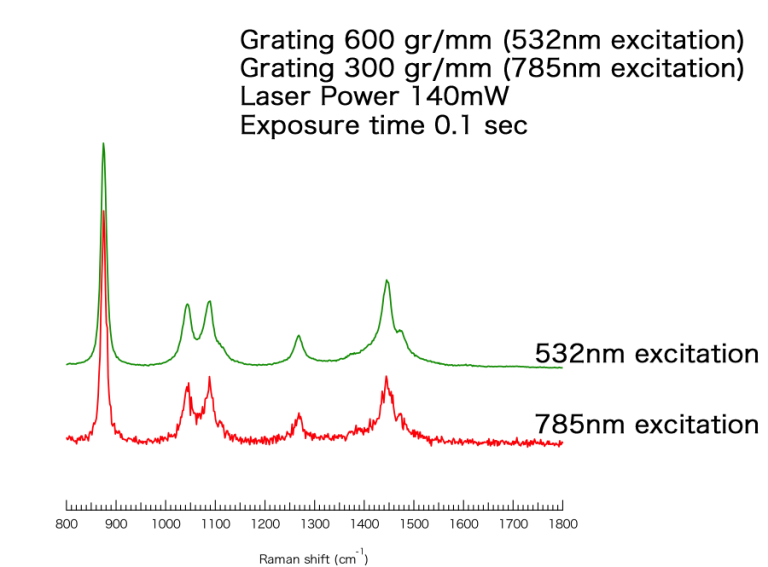
Excitation Wavelength……The figure below shows the Raman spectrum when using lasers with excitation wavelengths of 532 nm and 785 nm. At 785 nm excitation, the spectrum has a poor signal-to-noise ratio for weak peaks. On the other hand, in the case of 532 nm excitation, sufficient SN ratio is obtained for all peaks. If possible, the wavelength of the laser light is said to be short.
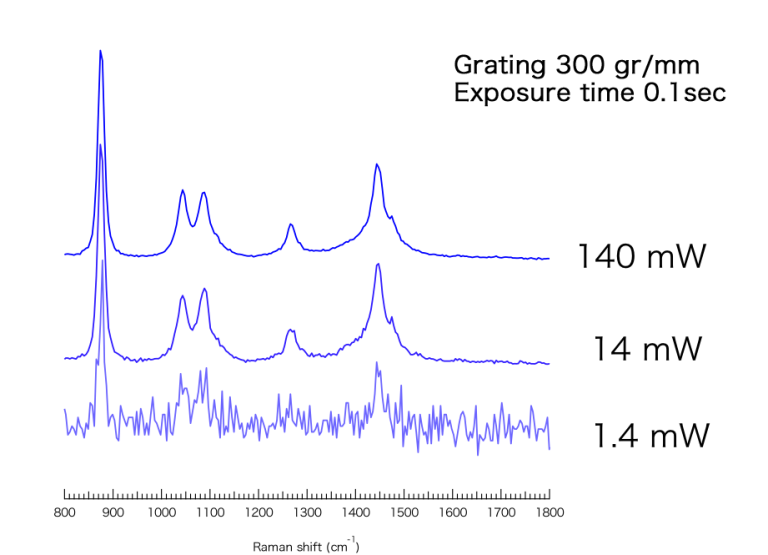
Laser power……The following figure shows the Raman spectrum when the irradiation power is changed to 1.4 mW, 14 mW, and 140 mW. At 1.4 mW, the spectrum has a poor SN ratio, but at 14 mW, which has a high single digit power, a sufficient SN ratio is obtained. When measured at 140 mW, the enough SN ratio of the weak Raman peak is also obtained.
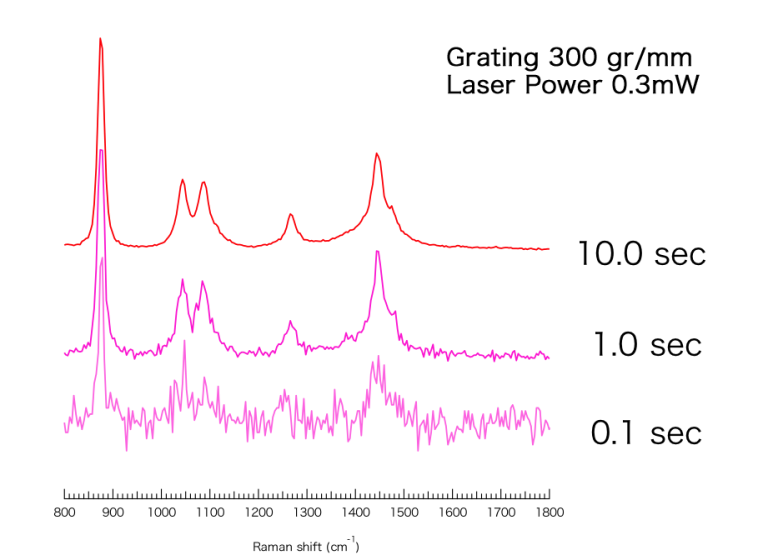
Exposure time……The following figure shows the Raman spectrum when the exposure time is changed to 0.1 sec, 1.0 sec, and 10.0 sec. At 0.1 sec, the spectrum has a poor SN ratio, but at a longer exposure time of 1.0 sec, a sufficient SN ratio was obtained for the intense Raman peak. At an exposure time of 10.0 seconds, the SN ratio of the weak Raman peak can also be measured.
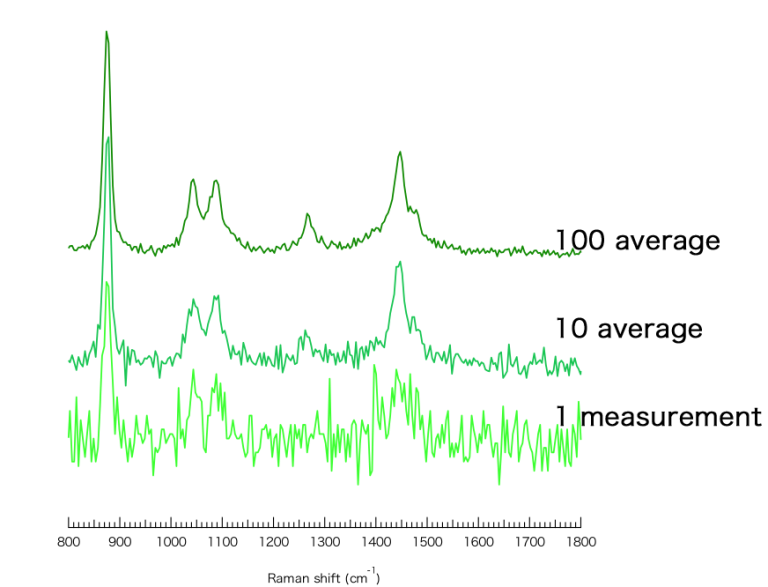
Averaging number……The figure below shows the Raman spectrum when the number of averaging is changed to 1, 10 and 100 times. It is a spectrum with a bad SN ratio in one measurement. As the number of measurements increases to 10 times and 100 times, the SN ratio improves.
Compared to the case where the above-mentioned exposure time is changed, the case of averaging 10 times with 0.1 sec of exposure time (0.1 sec × 10 times = 1.0 sec) and the case of measuring once with exposure time of 1.0 sec (1.0 sec × 1) In both cases, the total measurement time is 1.0 sec, but in the latter case, the SN ratio is somewhat better. In general, if you want to detect weak Raman peaks, measure with a longer exposure time than increasing the number of averages.
The important point “Don’t burn the sample!”
Typical change in spectrum due to charring
What happens to the spectrum if the sample is burnt? If you burn it firmly, the signal will shake off and you will feel as if you were measuring a sample that emits strong fluorescence. In the case of organic matter, broad D-bands and G-bands typical of carbon materials can be observed (D-band: 1350 cm-1, G-band: 1590 cm-1). In other words, the spectrum looks like that of a poorly characterized carbon material. At this time, other Raman peaks are often invisible. In addition, it may be difficult to determine if the sample is a carbon material or a burnt one for samples that contain a carbon material. In that case, change the power of other places, measure and compare and judge.
Measurement example of spectrum and light microscope image when charred
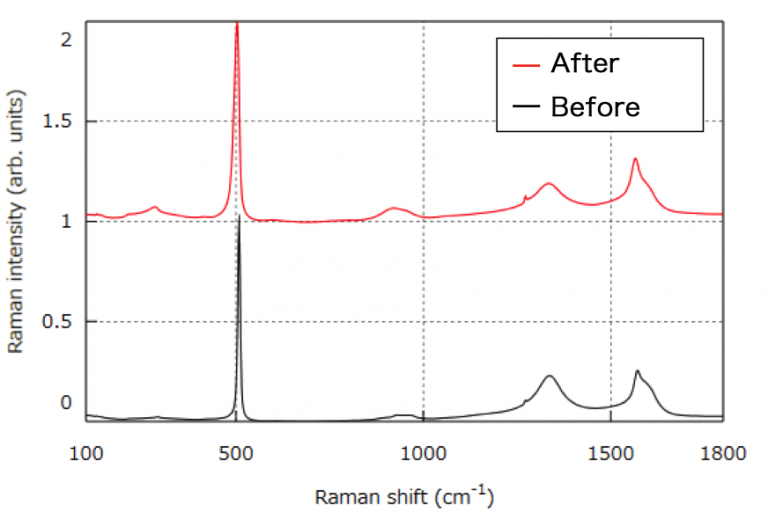
The changes of the spectrum and the optical microscope image are introduced using the electrode of the secondary battery as an example. Below is a comparison of Raman spectra and optical microscope images before and after burning. The Raman spectrum has a broad peak at 500 cm-1 due to burning of the material. The peak position of 900 cm-1 is slightly shifted to the low wave number side. The change in the crystalline state of the material is considered to have the above-mentioned effect on the Raman spectrum. There is a burnt mark at the position where the laser was irradiated in the optical microscope image.
Even in the above example, in order to obtain a Raman spectrum having a high SN ratio in a short time, it is necessary to set the irradiation power of the laser light as strong as possible without damaging the sample. I think you understand. In fact, even if the condition is not damaged, it is necessary to be careful because the temperature of the sample may rise during the process of acquiring the image and damage may occur.