The relationship between the diffraction grating, the wavenumber range, and the spectral resolution, and the change in Raman spectrum and Raman image due to the slit width will be explained together with the measured data.
Configure gratings
Concept of measurement wavenumber range and spectral resolution
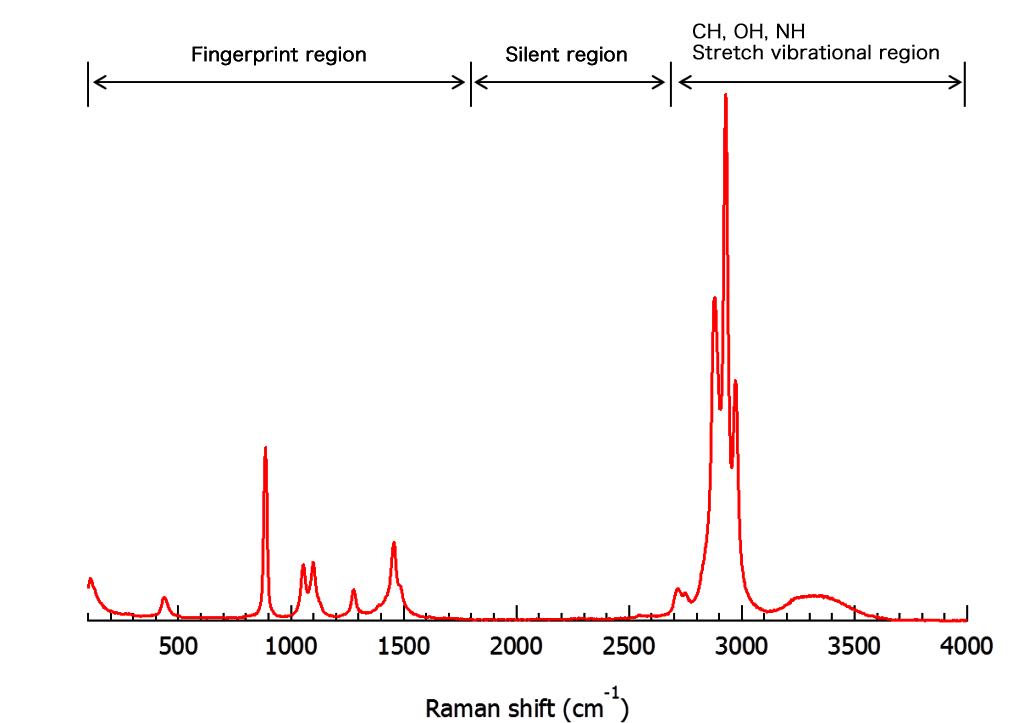
As with other analysis methods, Raman spectroscopy also needs to be set up according to the purpose of measurement. The spectrometer settings introduced here are the key points of the detection system. In general Raman spectroscopy, the range in which the Raman spectrum is detected is several tens to 4000 cm -1. The figure below is the Raman spectrum of ethanol. As shown in the figure, the wave number area can be roughly divided into fingerprint region, silent region, and CH / OH region.
Depending on the purpose of the analysis, the configuration may differ depending on whether the full wavenumber region is roughly viewed or only a narrow area of the Raman band is viewed in detail, in a single exposure. In addition, in the case of Raman imaging, an element of spatial resolution is included. Specifically, the spectrometer settings include the slit width of the spectrometer entrance and the selection of the grating.
First, let’s look at the features of the diffraction grating. In the following, as an example when measuring with a 532 nm light source using a spectrometer with a focal length of 500 mm, we will give an indication of the measurement wavenumber range for each diffraction grating.
| In same light intensity | Grooves (gr/mm) | Wavenumber range width | Application |
| Signal strong | 300 | ≒4000 cm-1 | A broad wave number range can be seen roughly. |
| 600 | ≒2500 cm-1 | Standard About 700 cm-1 to 3000 cm-1 can be seen at a central wavenumber of 2000 cm-1. | |
| Signal weak | 1200 | ≒1000 cm-1 | Although there is a limitation of the measurement range such as only the fingerprint area, only the CH / OH area, it is selected when you want to know the wave number position information in detail. |
| 2400 | ≒200 cm-1~ 400 cm-1 | Select when you want to measure the wave number most precisely, such as stress shift measurement. |
The measurement wavenumber range changes depending on the combination of the excitation laser light wavelength and the diffraction grating. In addition, even if the wavelength of the excitation laser light is the same, the measurement wavenumber range also changes depending on the device (manufacturer), that is, the combination of the focal length of the spectrometer and the diffraction grating.
Relationship between grating grooves, wavenumber region and intensity
There is a difference between the wavenumber range that can be measured and the apparent intensity of the Raman intensity that can be obtained for each grating ruling of the diffraction grating. If the number of rulings is small, a wide wave number range can be measured and strong Raman intensity can be obtained, but the spectral resolution will be low. On the other hand, when the number of rulings is large, the spectral resolution can be measured high, but only a narrow wave number range can be measured, and the Raman intensity also becomes weak. As a standard when measuring at 532 nm excitation, if you start from 300 gr / mm when measuring organic material and when starting from 600 gr / mm when measuring inorganic material, you can capture the entire image of the spectrum. The figure below shows an example of measuring ethanol for the measurement wave number range and intensity, and an example of measuring carbon tetrachloride for spectral resolution.
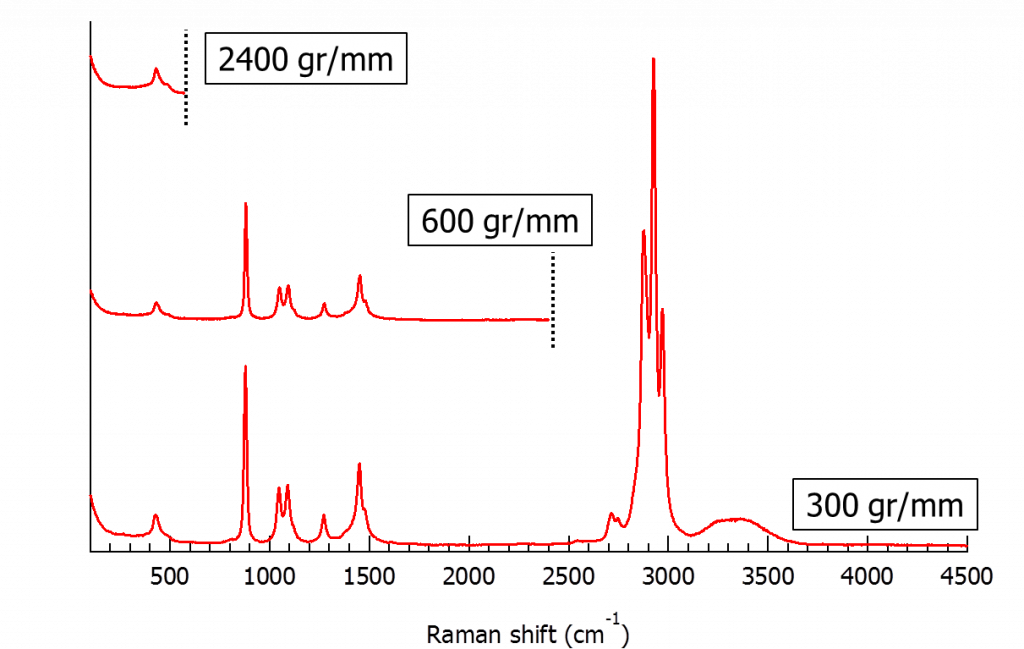
Example of measurement wave number range
(Sample: ethanol, all measurement conditions except diffraction grating are the same)
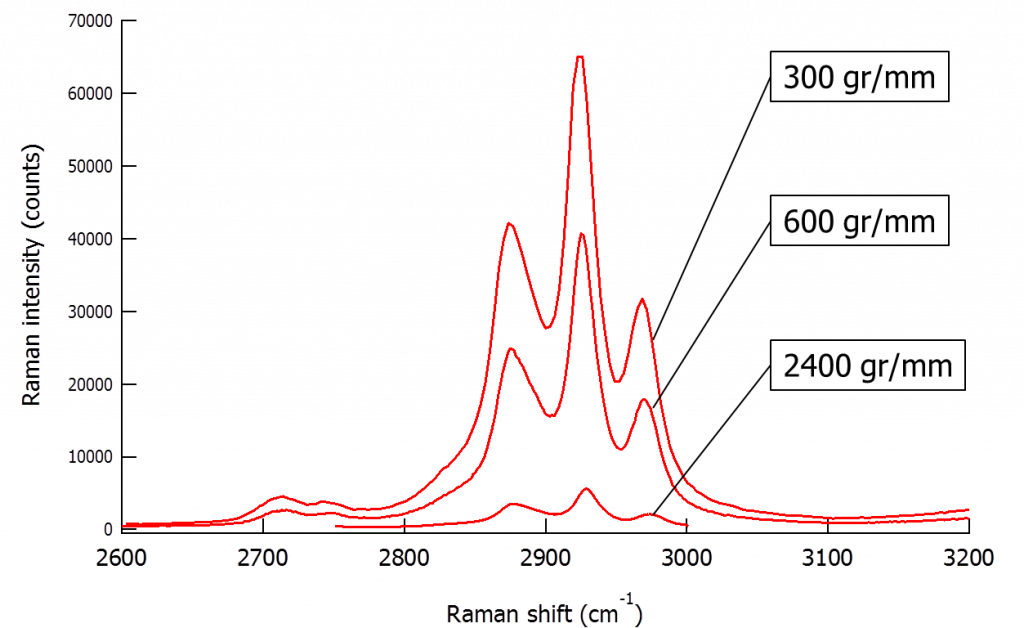
Example of intensity
(Sample: ethanol, all measurement conditions except diffraction grating are the same)
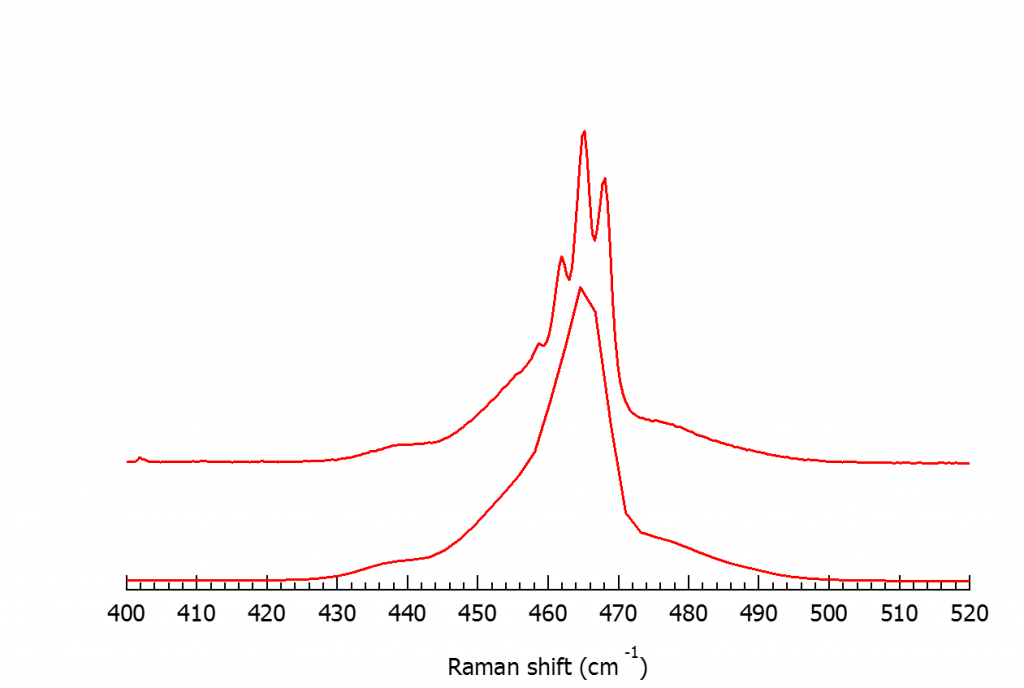
Example of spectral resolution
(Sample: Carbon tetrachloride, all measurement conditions other than diffraction grating are the same)
Configure the slit width
The spectral resolution and the Raman intensity also change by changing the slit width of the spectrometer. The setting differs depending on whether you look at the Raman band in detail, or prioritize the intensity to shorten the measurement time or observe weak peaks. Also, as mentioned above, in addition to these in the case of Raman imaging, it affects spatial resolution.
General spectrum change (change in spectral resolution)
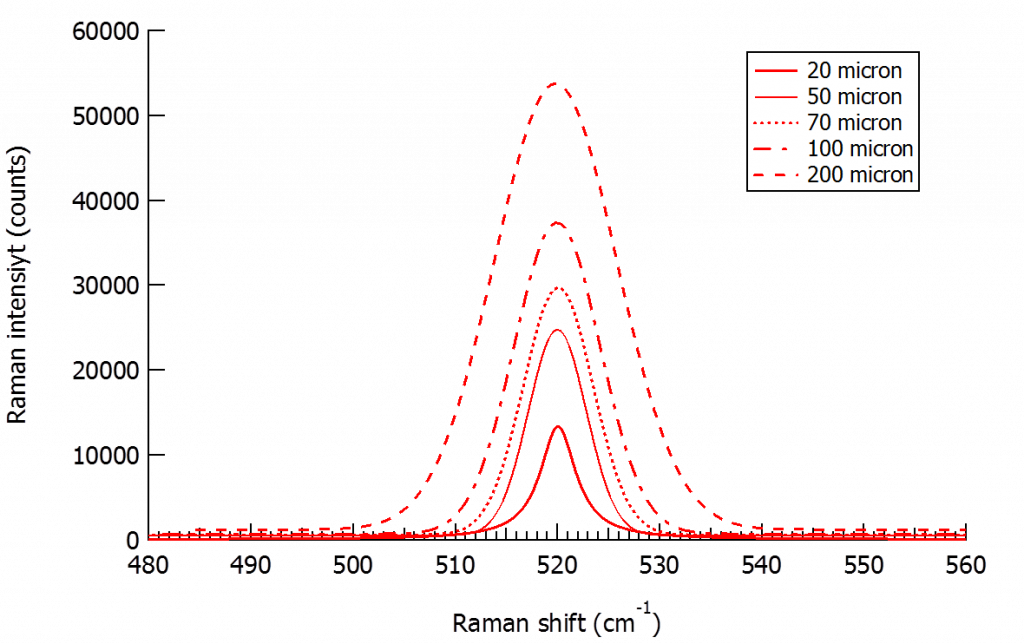
The figure below shows the change of the full width at half maximum of Raman band and the intensity when the slit width is changed. Narrowing the slit width reduces the full width at half maximum, resulting in high spectral resolution. On the other hand, when the slit width is increased, the spectral resolution is degraded but the Raman intensity is increased. If the analysis purpose can be achieved only by determining the presence or absence of peaks, expanding the slit width may be sufficient as a result.
Change in spatial resolution
The figure below shows the change in Raman image when the slit width is changed. In the example of measuring a bundle of carbon nanotubes (CNT), only the slit width is changed. The sharpest Raman image is obtained when the slit width is 20 microns. As the slit width is increased to 50 microns and 100 microns, the Raman image of CNTs is blurred.

Slit width: 20um

Slit width: 50um

Slit width: 100um