Software
Outstanding software is required to analyze the large amount of data from high quality Raman images. The software provided by Nanophoton is equipped with high-speed data processing capacity and miscellaneous analytical functions to support imaging analyses performed by RAMANtouch/RAMANforce. Parts of its functions are introduced here.
Functions
Measurement function
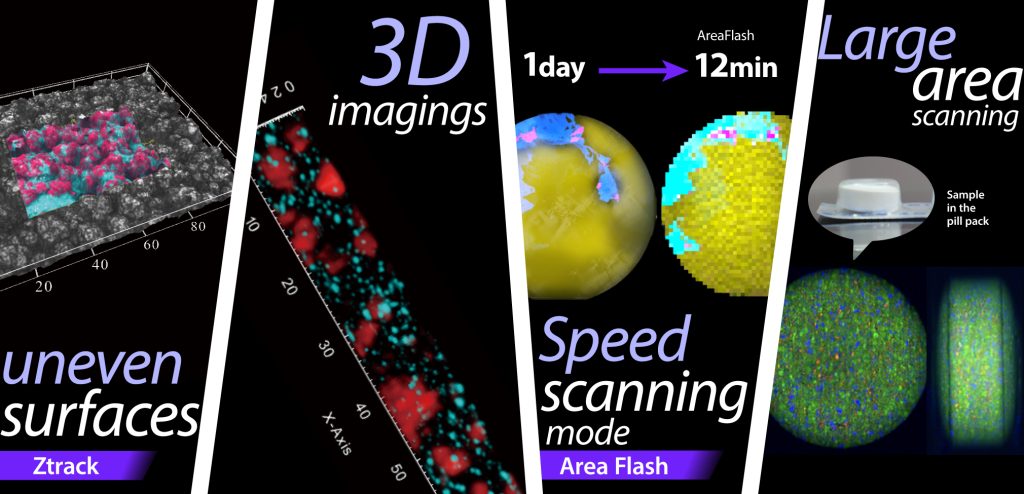
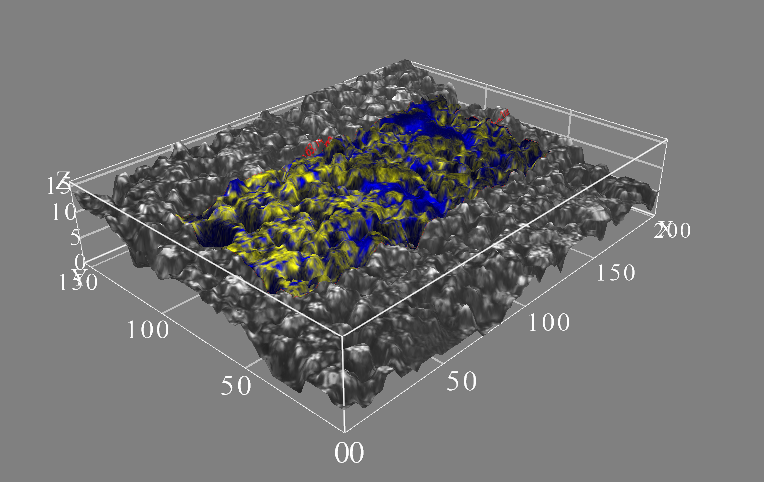
ZTrack
This is a measurement function that recognizes the surface shape of a sample from an optical microscope image and performs Raman imaging along the surface shape. Even with samples that have been uneven due to surface irregularities, it is possible to obtain clear Raman images without blurring. Optical microscope images and Raman images can be displayed according to the surface shape, and the relationship of the distribution of the material with irregularities can also be checked.
AreaFlash
By scanning line illumination at high speed in the vertical direction, it is possible to acquire a wide range of average spectrum with one exposure. In addition to being wide measurement area, the 400 spectra on the CCD are integrated into a single spectrum, resulting in very sensitive data. Using AreaFlash, you can compare average spectra between samples and easily track changes over time in the spectrum.
Wide field AreaFlash
By combining the motorized stage and the AreaFlash, a wide range of spectrum mapping measurements can be realized at high speed.
Although it was difficult to measure a wide area without gaps only with stage scanning, it is possible to measure the entire sample without gaps by combining it with laser scanning. AreaFlash provides very sensitive spectra, allowing measurement in a short time, even over a wide range.
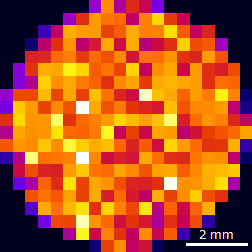
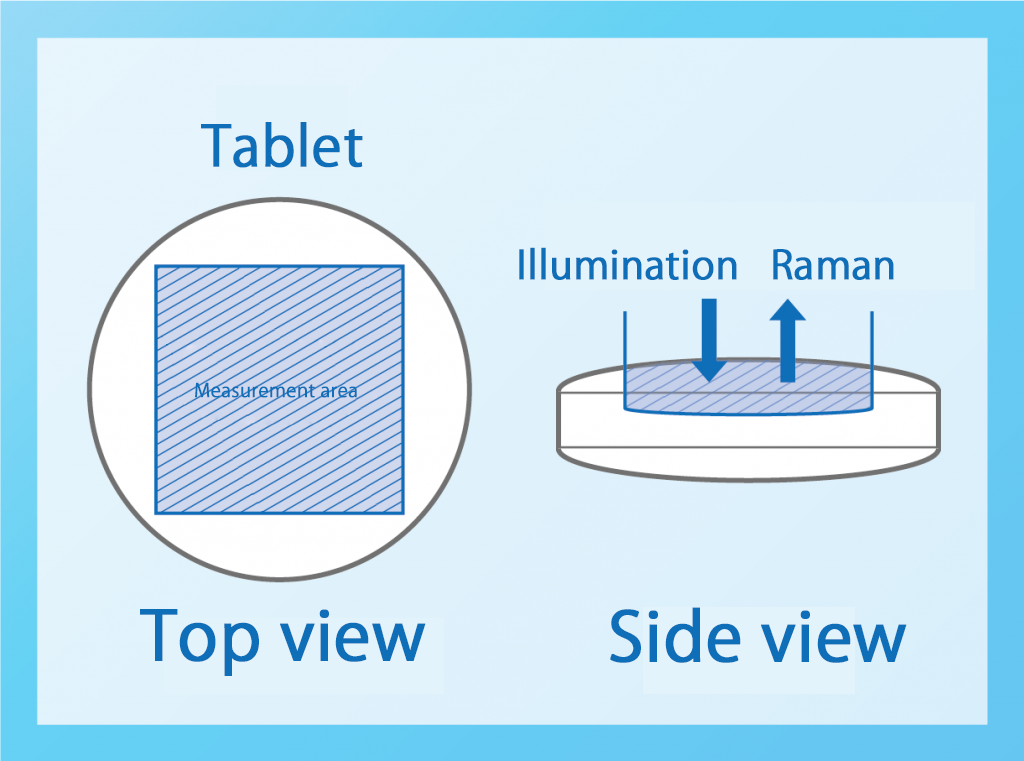
Example of wide-field AreaFlash for a tablet. A pixel size is around 400µm, 20 x 20 pixels.
VolumeRaman
It is a function to measure the average spectrum of 6mm x 6mm at a time by scanning the laser on the line at high speed with a low NA (0.04) objective lens. For tablets, because the diffusion effect can provide information up to a depth of about 0.5 mm inside, about 18 mm3 of volume area is the target of Raman measurement.
Calibration by integrated reference sample
*Patented
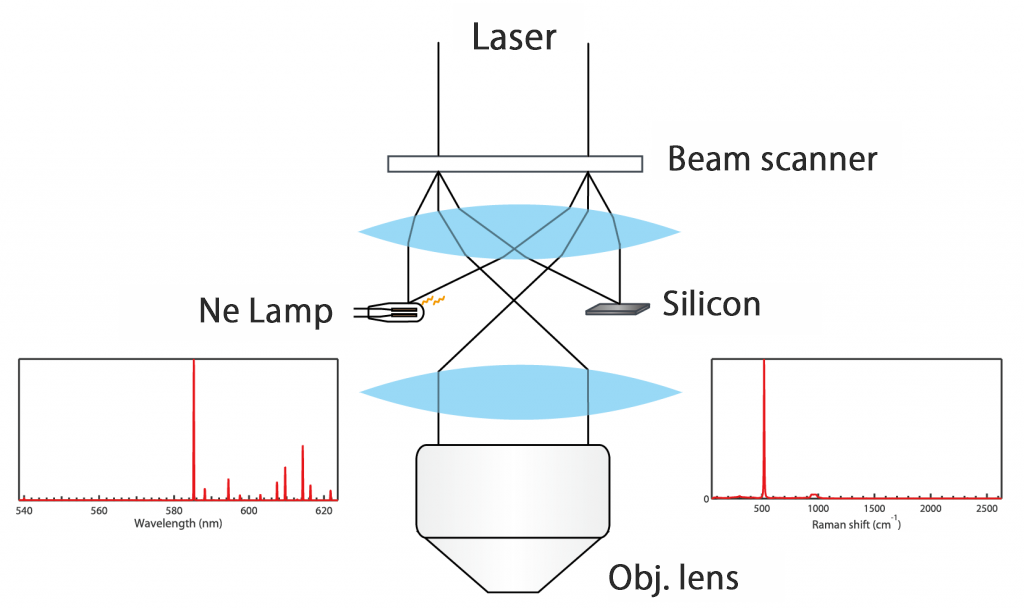
RAMANtouch has an internal reference sample for calibration. By measuring the reference sample by laser scanning, wavenumber calibration can be performed without placing the calibration sample on the stage. Since wavenumber calibration can be performed even during measurement, it is possible to correct slight changes in peak position due to changes in room temperature during measurement by measuring the spectrum of the reference sample at regular intervals. It works particularly well for long-term measurements.
Fast, high-resolution 3D Raman Imaging
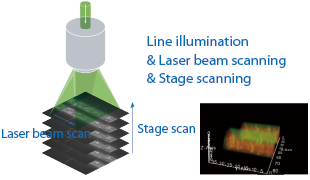
Using confocal optics, which detects Raman light inside the sample nondestructively, a 3D Raman image of a transparent sample can be obtained. This function repeats ultra-fast XY Raman imaging using line illumination several times while changing the stage height, and stacks the slices to create a 3-dimensional image in memory. By using the high imaging speed and depth resolution of RAMANtouch/RAMANforce, a more intuitive understanding can be obtained of the internal structure and component distribution inside a sample.
Application note
→不織布用繊維の内部構造の非破壊観察
Brand-new wide field-of-view imaging along curved surface
RAMANtouch/RAMANforce has a brand-new wide field-of-view (FOV) Raman imaging capability. It automatically measures the surface height of a sample while capturing a wide FOV microscopic image, and makes it possible to measure a wide FOV Raman image with auto-focusing. As the images show on the right, a fine focused Raman image can be obtained from all over the surface of a curved tablet.
The measurement algorithm is further improved to speed up the imaging 3 times faster than our previous RAMANtouch model.
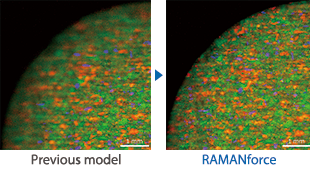
Wide FOV imaging of curved surface of a tablet
Fully automated particle scanning (option)
This function detects particles in a microscopic image, and Raman measurements are automatically carried out with quick auto-focus. Fully utilizing our fast and accurate laser beam scanning technology, Nanophoton has developed three different measurement modes: “auto point measurement at center of each particle”, “auto scanning of whole surface of each particle to get averaged spectrum”, and “auto Raman mapping of each particle with arbitrary scanning pitch”. Detected spectra are automatically identified using a real-time spectrum search during measuring. Measuring and analysis according to size classes as defined by ISO 16232 is also possible.
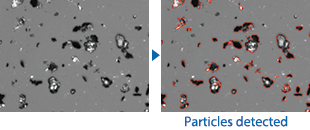
Detect partcles automatically in microscopic image
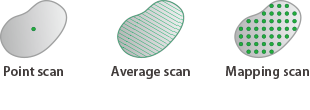
3 useful measurement modes
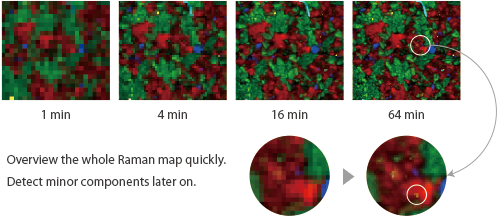
Interlaced Raman Imaging for quick overview
Interlaced imaging scans a sample skipping some pixels to quickly obtain a rough Raman image, then keeps scanning the rest while the Raman image becomes finer and finer. This mode will be the best scanning mode for a quick overview of component distribution.
Analysis functions
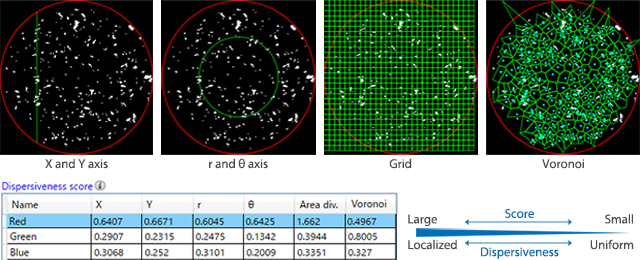
Quantitative analysis of components dispersiveness
This function is to obtain a quantitative analysis of component dispersiveness such as uniformity, aggregational states and locality in a Raman image. Such can be investigated from every possible angle by counting the number of particle outlines along an evaluation axis such as (X and Y) or (r and θ), or calculating the standard deviation of number of particles in a (grid) or (Voronoi diagram) layout.
Automatic generation of Raman Image
It is a function that automatically recognizes peaks contained in Raman image data and generates a Raman image. Even by changing the number of components that you want to display from the setting screen, you can easily generate a Raman image even for beginners, because they are imaged from components with large Raman peak intensity.
In addition, this function is useful when you do not know the peak position in advance due to deterioration of unknown samples or materials, or when searching for weak peaks.
Export to PowerPoint
It is a function to output data to the template file of PowerPoint prepared in advance.
・ Raman image
・ Spectrum
・ Measurement condition
The necessary data can be arranged on the slide with one click because it can be output at once. After that, you can make fine adjustments on the PowerPoint and create reports in a short time.
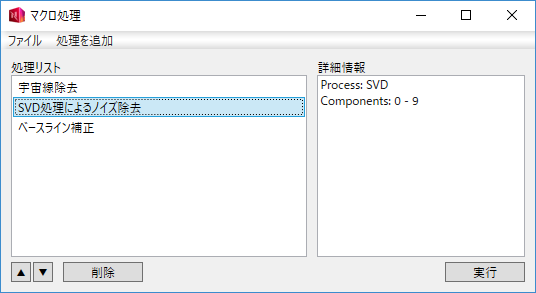
Macro process
It is a function to execute the registered analysis function at one time. A series of processes can be easily performed on data for which analysis procedures have been determined.
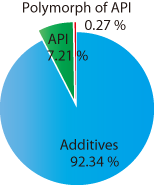
Composition rate evaluation by area ratio analysis
The composition rate of a sample is evaluated from a Raman image which shows the distribution of components. It is calculated from a binary Raman image, which is made assuming that each pixel corresponds to only one component. Composition rate can also be calculated using CLS as described below.
Particle size analysis of a component from the Raman image
Statistical analysis of particle sizes for a specific component can be carried out from the Raman image. Approximating a particle as an oval, size distribution can be indicated in a histogram on a number basis, area basis and volume basis. The statistics (maximum, minimum, average value, standard deviation, etc.) can also be calculated.
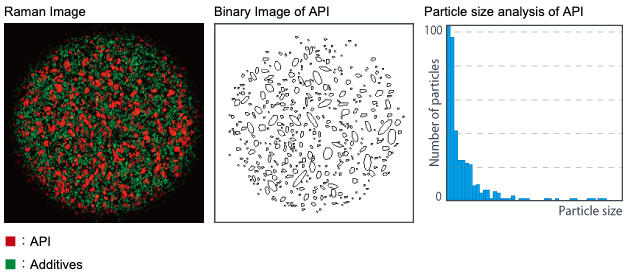
※The size related information was deleted because samples are commercial products
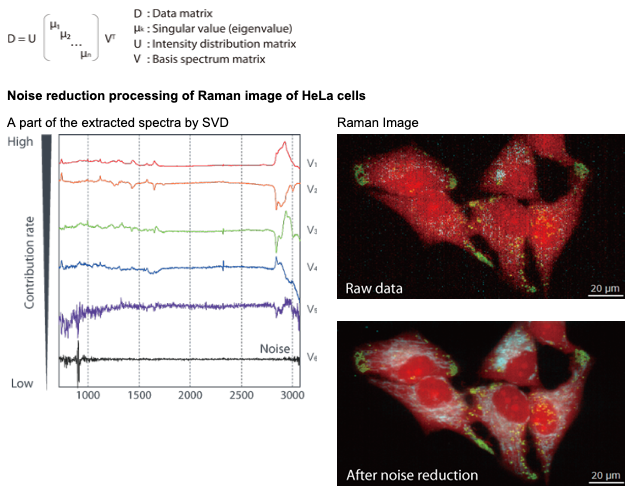
Noise reduction by Singular Value Decomposition (SVD)
First extract the orthogonal spectra from the Raman image and place them in descending order of contribution. By reconstructing the Raman image after the removal of spectra with a low contribution ratio (i.e., noise reduction), a clear Raman image consisting of high S/N spectra can be obtained even if the S/N of raw data is non-optimal.
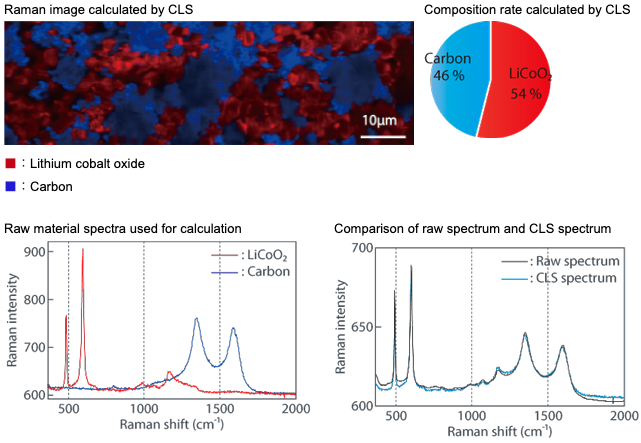
Linear combination analysis by Classical Least Squares (CLS)
Represent the unknown spectrum by a linear combination of known raw material spectra and calculate intensity of the known spectra by the least squares method. A quantitative evaluation of the composition is applicable using raw material spectra obtained under the same measurement conditions.
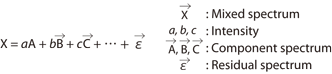
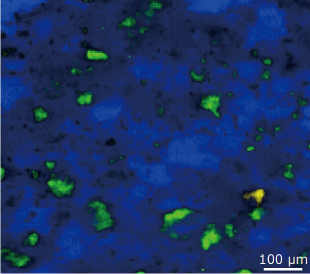
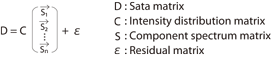
Multivariate Curve Resolution (MCR)
MCR extrapolates the component spectra by assuming that the unknown spectrum can be expressed by linearly combining a finite number (N) of component spectra and that both the spectrum intensity and concentration of each component have non-negative values. ALS (Alternating Least Squares) (which allows for a quick calculation), and MUR (Multiplicative Update Rule) (which guarantees convergence) are both installed and available.
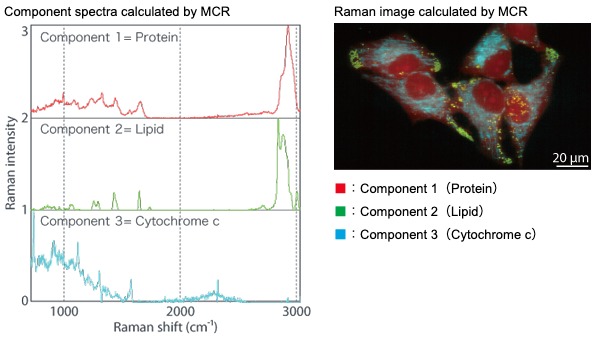
MCRを用いて計算したHeLa細胞のラマンイメージ