Email Magazine
Measurement of food 1 (3/3/2021)
Raman microscopy, which catches faint Raman scattered light emitted from molecules, can distinguish between different types of molecules and produce images. In the past, I have tried to measure multi-layered packaging plastics in this corner as a “free study for adults”, but this time I tried it with a familiar food. This time, I tried it on a familiar food: cream from a convenience store’s sweet bread. In addition, we also looked at the fat and moisture content of mayonnaise and butter. So, what were the results? (e-mail Newsletter editor-in-chief/freelance writer Takeshi Nemoto)
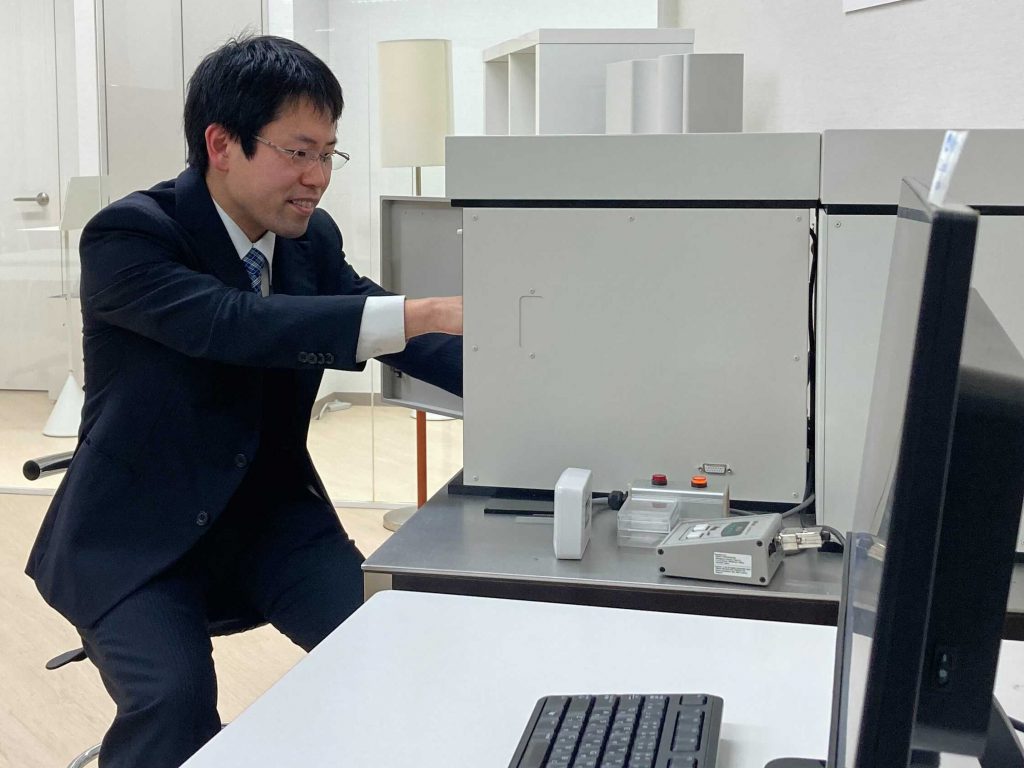
I asked Katsuhito Aoki, a sales and applications engineer working in the Tokyo showroom, to take the measurements. When I met him in the past, he said, “I sometimes measure things around me, wondering what they are like. At that time, he mentioned “bread with cream in it from a convenience store. So, I decided to have him measure it again.
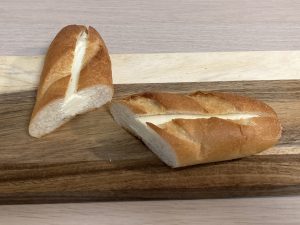
This is the bread. Place the cream inside on a glass slide and put a cover glass on top to make a preparato. It is the same as a science experiment.
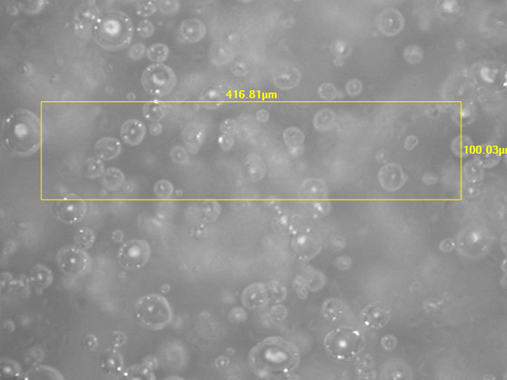
The optical microscope image is shown above. When the area in the yellow frame was measured and analyzed by Raman microscopy, the image below was obtained. You can see the distribution of fat, sugar crystals, liquid sugar (sugar + water), and air. This is a world that cannot be seen with an ordinary microscope. The graph shows the Raman spectra of the three measurement points. The horizontal axis is the Raman shift (wavenumber, cm-1) and the vertical axis is the intensity of Raman scattered light. To make it easier to see, the data is shifted.

Now, how did we analyze these results?
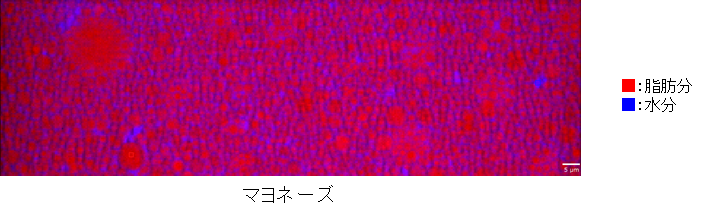
According to Mr. Aoki, if the components are known, the positions of the characteristic peaks in the spectrum can be roughly determined. Then, the color of the image is shaded according to the size of the peak, and the distribution of the component can be seen in the image. In this case, since it was expected that fat and water would be included, the image was created with the peak characteristic of fat around 2854 cm-1 in red and the peak characteristic of water around 3150 to 3600 cm-1 in blue.
I also found other areas where sharp peaks appeared in the water, so I selected a peak (around 358 cm-1) that did not appear in the fat and water spectra and turned it green. Finally, I decided that the area that remained black was probably air, because the spectrum of fat content was observed to be noticeably weaker than the surrounding area, and it looked like a bubble under the optical microscope.
So what is green? There is a database that contains Raman spectra of various molecules as a powerful tool to determine the ingredients, and when you do a search, it shows you candidates in the order of closest spectra. In this case, I searched the spectrum of the green part and found that it was lactose hydrate.
In addition to the water peak, the spectrum of the blue area shows a characteristic peak. Mr. Aoki had previously measured the Raman spectrum of liquid sugars such as sugar water and gum syrup, and since the spectrum was similar to the one he had measured, he determined that the blue area was water plus sugar, not just water.
Incidentally, the Raman spectra of the sugar crystals and liquid sugar portions show the difference from the Raman spectra of the fat content. This is because the peaks of lipids tend to be observed relatively strongly in Raman spectroscopy, and the peaks of fat content appeared in the sugar crystal and liquid sugar portions in this case as well, so the spectrum of fat content was drawn to make it easier to see the difference.
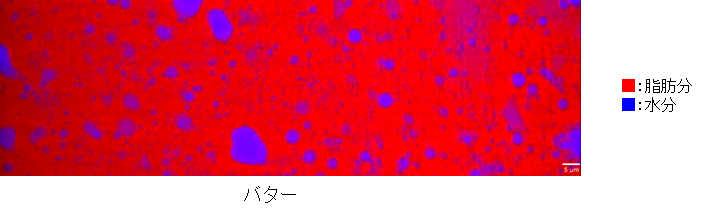
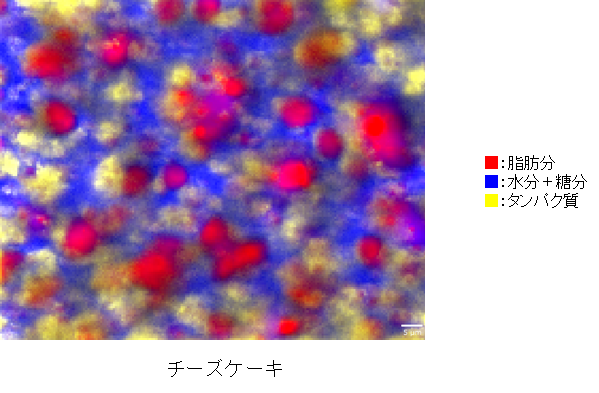
In addition to cream, he also measured mayonnaise, butter, and rare cheese cake, and the results are shown below.
Finally, here are some comments from Mr. Aoki.
“I was surprised at how beautiful the images were. Infrared imaging often has a problem where the water peak is too strong, making it difficult to see what you want. In Raman spectroscopy, the water peak is visible but not as strong, and the lipid and benzene ring peaks are observed more strongly. Therefore, even samples containing water can be easily measured, and the spatial resolution is higher than that of infrared imaging.
Also, in this example of cream, we were able to distinguish the difference between sugar in liquid form (dissolved in water) and sugar in crystal form. Such differences in the state of matter are also important information that can be determined from the spectrum.
I think Raman spectroscopic imaging is quite suitable for the analysis of samples containing water, such as biological samples and foods. If you have a sample that you are wondering if it can be analyzed with Raman, please contact us.”
Next time, I will try to think of ways to deepen this free research.