Email Magazine
The Path to Mastery
This time, I tried to measure cheese. I started with a light heart, thinking, “If I follow this example, it will be a piece of cake,” since “Observing the distribution of ingredients in cheese by Raman spectroscopy” is available on Nanophoton’s website ……. According to Ms. Mariko Adachi, Senior Engineer, Sales & Applications at Nanophoton, it was a “challenging” challenge. Anyway, I made the measurements by myself through trial and error. Finally, I asked Ms. Adachi to look at the data and remove noise, etc. As a result, I am satisfied that we were able to obtain a reasonable Raman image. (Takeshi Nemoto, Editor-in-Chief of the Email newsletter/science writer)
Cheese, they say, can be made at home. Since my third junior high school son and my wife were going to try making mozzarella cheese, I decided to measure the cheese with my RAMAN microscope RAMANtouch.
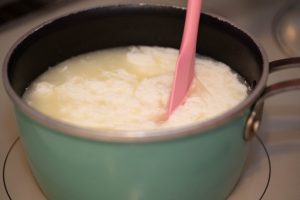
Incidentally, cheese is originally made by adding lactic acid bacteria and an enzyme called “rennet” to raw milk. In this case, based on online information, non-homo milk (milk without homogenized fat) was heated to around 63 degrees Celsius in a pot, vinegar was added and stirred to make it. Non-homo milk was not available at the local supermarket, so I obtained it at a natural food store.
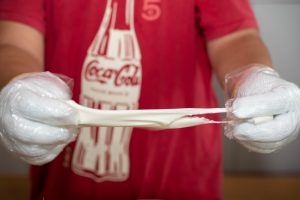
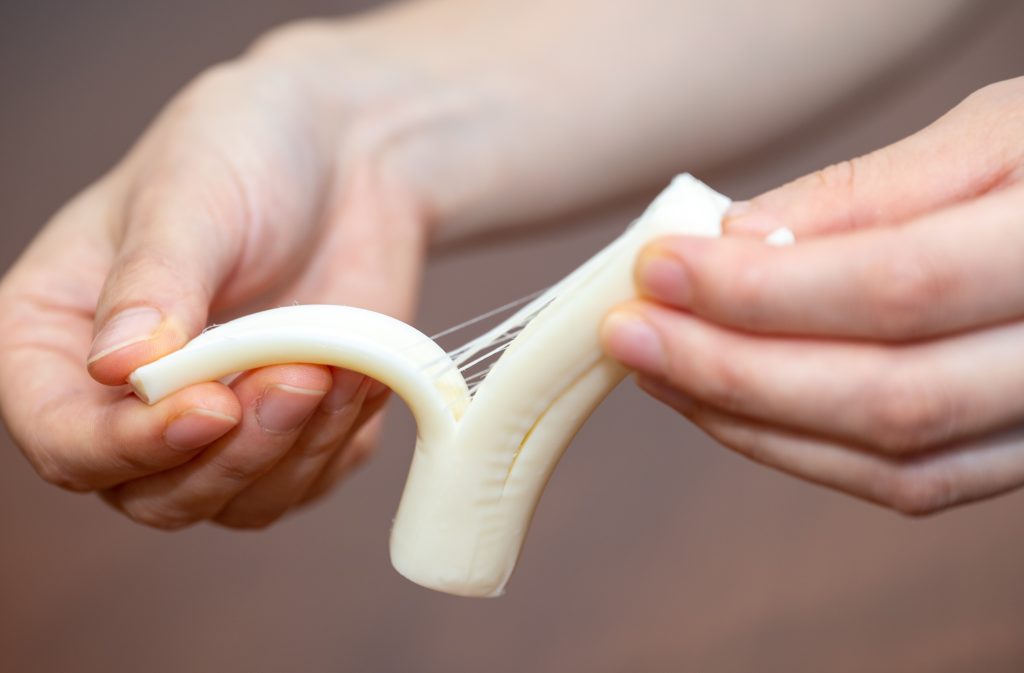
The cheese is now properly lumpy. After this process of stretching and folding the cheese while it is still hot is repeated many times, the cheese becomes a fibrous “shredded cheese”. However, our homemade cheese did not stretch very well, and it became a “thick, crumbly cheese.
Now, why does cheese grow? According to NHK tv program “Chiko chan’s Don’t sleep through life!” aired in July this year, “Cheese stretches just like a stocking stretches. Cheese is mainly composed of protein, fat, and water. When it is hardened, the fat and water are contained in a mesh structure made of a protein called casein. When heat is applied to it, the casein softens and changes, and when it is pulled in this state, it stretches while still containing fat and other substances in its mesh structure. The program compared this situation to a stocking.
I found this diagram on the website of Snow Brand Megmilk.

Initially, I was going to look at homemade mozzarella and shaved cheese under the Raman microscope, but all the cheese at this time ended up in our family’s stomachs as pizza ingredients. I will eventually try again to measure homemade cheese.
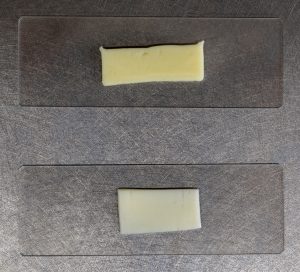
So, here are the measurements on the RAMANtouch. Processed cheese and cheese slices were purchased at a supermarket, cut into thin slices, and placed on a glass slide.

I tried different magnifications of the objective lens, laser power, and exposure time. In the end, we measured with 20x objective lens, 10 seconds exposure time, and maximum laser power. It took 12-13 minutes from the start.
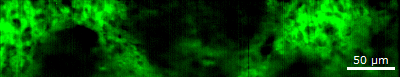
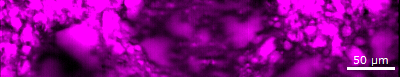
After the measurement, the distribution was imaged from the peak intensity at 2854 cm-1 for fat and 3060 cm-1 for protein. For details, please refer to the handbook “Observation of Component Distribution in Cheese by Raman Spectroscopy”.
Now let me show you some Raman images. First, the processed cheese.
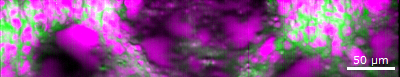
Next is the shaved cheese.

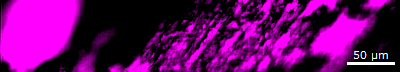

The stripes of the shredded cheese were recognizable. The direction of the stripes was consistent with the direction of the cheese. To obtain a cleaner image, it may be necessary to devise a better cutting process. In the example, they processed frozen sections. In this case, I just cut it with a knife.
In just a few hours, I was able to obtain a Raman image, even though I am almost an amateur. Well, it is fun.