Email Magazine
Measurement of food 2 (3/31/2021)
In this issue, we continue our “free research for adults” using the Raman microscope. In the previous free study, we measured the cream of a sweet bread from a convenience store using a Raman microscope to visualize the distribution of fat, liquid sugar, and air. However, there are many kinds of sugars. Therefore, we decided to measure aqueous solutions and syrups of various sugars to see if there were any that were similar to the Raman spectrum of liquid sugar detected in the cream of the sweet buns. (e-mail Newsletter editor-in-chief / freelance writer, Takeshi Nemoto)
First, let’s review the last time.
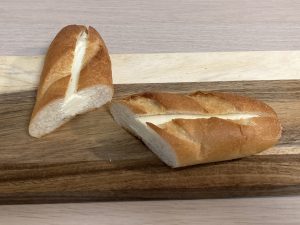
I bought a loaf of sweet bread at a convenience store and measured the cream inside, which revealed the distribution of fat, liquid sugar (sugar + water), and air.
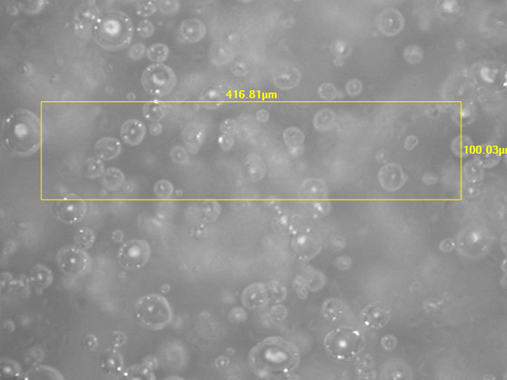
was measured and analyzed by Raman microscopy).
The image below is a Raman microscopy image showing the distribution.

This time, in order to investigate the ingredients that we determined to be “liquid sugar,” we purchased sugar and syrup at a supermarket and measured their Raman spectra. As before, we asked Katsuhito Aoki, Sales & Applications Engineer at Tokyo Showroom, to take measurements, analyze and explain the results. The samples we measured were as follows
- Sucrose (stick sugar for coffee) aqueous solution
- Glucose (glucose) solution
- Fructose glucose liquid sugar (gum syrup)
- Lactose fructose oligosaccharide aqueous solution
- Maltose syrup
- Non-caloric syrup
What kind of Raman spectra did you get for each? The results, including the cream of the bread, are shown below.
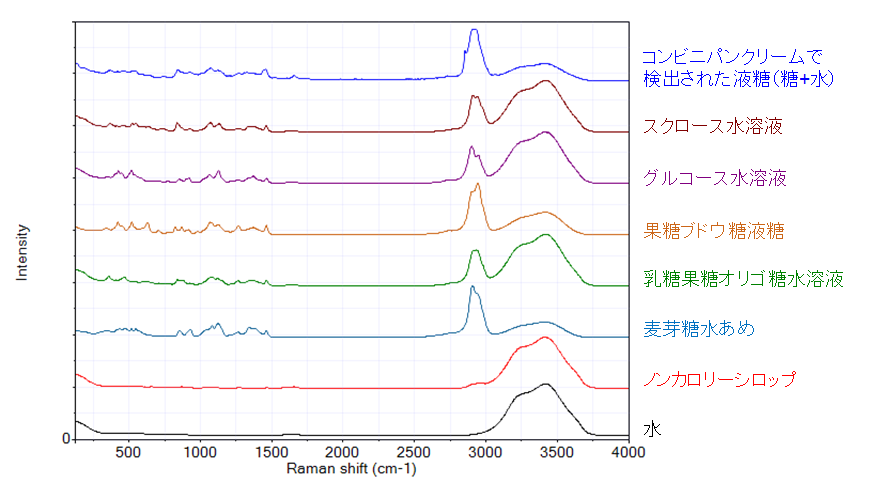
The part of the Raman spectrum below 1500 cm-1 is called the “fingerprint region”, where the differences between molecules are clearly visible. Let’s take a closer look at the fingerprint region.

In the region below 650 cm-1, the appearance of peaks differs greatly depending on the type of sugar. Therefore, by looking at the spectrum in the region below 650cm-1, we can estimate which type of sugar is mainly contained in the cream of bread in convenience stores.
Now let’s compare them in detail.
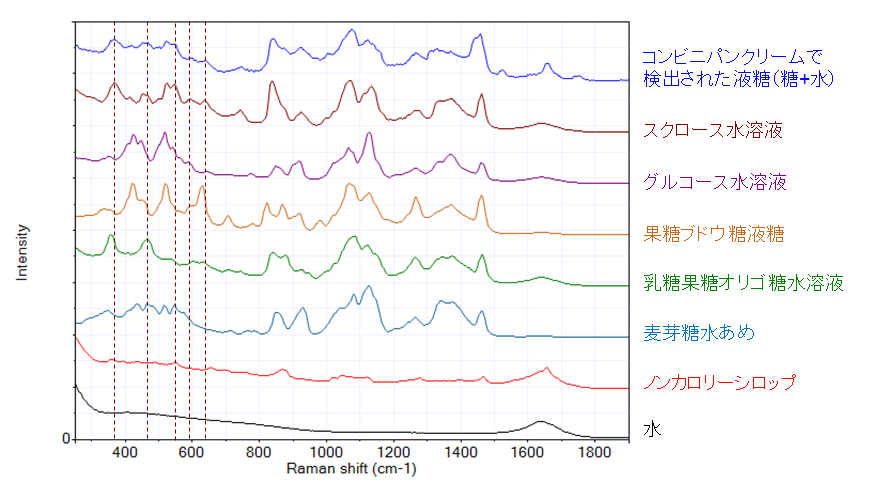
Comparing the relationship between the positions and heights of the peaks in the Raman spectrum, we can see that it is the aqueous sucrose solution that most resembles the liquid sugar detected in the cream of the bread at the convenience store. In particular, the peak indicated by the dashed line has a different peak position or does not appear in the other sugars. Therefore, we could estimate that the main ingredient dissolved in the water in the cream of convenience store bread was sucrose (sugar).
When investigating an unknown component, as in this case, the spectrum of the unknown component is compared with the spectrum of a known substance for identification.
Mr. Aoki said
“For component identification, you can use commercially available spectral libraries. Even if the spectra are not included in a commercial library, if you can predict the components to some extent, you can search for similar spectra by measuring the candidate components in advance and building your own library, as in this case. The shape of the spectrum of a sugar varies greatly depending on whether it is an aqueous solution or a crystal, so it is useful to build your own library. A similar example is the inspection of foreign substances in a factory. If you measure the Raman spectra of foreign substances that may be mixed in, it is easier to identify the components of the foreign substances and the source of contamination.
He explained.
There is a possibility that lactose (lactose) is also included in the liquid sugar component, but since we could not get lactose at the supermarket, we did not measure it this time. However, lactose is less soluble in water than sucrose, and even if it is present, it is thought to be less soluble than sucrose.
By the way, only the non-caloric syrup had a Raman spectrum shape very different from other sugars and syrups, and very similar to water. If you calculate the difference between the spectra of non-caloric syrup and water, you can see the peaks of the dissolved components.
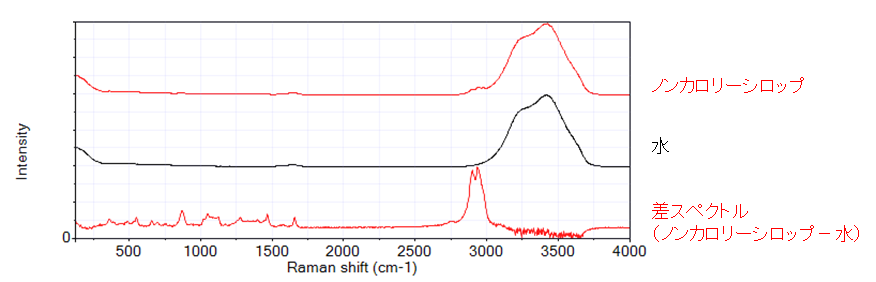
The package of the non-caloric syrup listed erythritol, acesulfame K, sucralose, xanthan gum, and vitamin C as ingredients. It is likely that a mixture of these peaks appear in the difference spectrum.